Execution problems rarely announce themselves politely. One minute the platform feels normal. The next minute spreads widen, orders reject, and support tickets start piling up with the same complaint phrased twenty different ways. This is exactly where a monitoring mindset pays for itself.
The goal is not perfection. The goal is visibility and control: detect degradation early, pinpoint the cause fast, and respond consistently. In practical terms, a mature brokerage setup monitors all liquidity sources and treats liquidity health as a live system, not a static vendor checkbox.
“If you cannot explain a full minute, you do not have an execution process, you have a debate.”
This guide breaks down the execution chain, the monitoring stack that actually helps on busy days, and simple playbooks that protect both clients and internal teams.
The execution chain in 90 seconds
Every order travels through a chain of components that each introduce risk, latency, and potential failure points.
At a high level, you usually have:
- price sources producing quotes
- aggregation or routing logic selecting a path
- risk checks approving or rejecting the order
- a bridge or gateway sending the order downstream
- liquidity venues responding with a fill, reject, or partial fill
- post-trade systems storing logs and producing reports
When people talk about trading orders execution, they often focus on the final fill price. In operations, execution is broader: quote integrity, routing discipline, latency consistency, reject clarity, and evidence trails.
Where execution commonly breaks
These are the most frequent “it feels broken” scenarios that show up in real support queues:
- Spread blowouts outside expected news windows
- Quote staleness where the price looks valid but is outdated
- Reject spikes tied to one route or symbol group
- Latency spikes that turn normal market orders into slippage events
- Partial fills that surprise clients and complicate hedging
- One-sided slippage that triggers fairness complaints
If you monitor only average spreads and average latency, you will miss the exact moments that create 80 percent of the complaints.
Liquidity monitoring is harder than it sounds
Many teams think they are monitoring liquidity because they can see “current spread” and “current price.” That is closer to a live wallpaper than monitoring.
Liquidity is dynamic. It changes by:
- session (Asia vs Europe vs US)
- instrument group (majors vs minors vs metals)
- market regime (range, trend, event-driven volatility)
- venue behavior (depth, rejections, timeouts)
- internal load (risk checks, databases, network)
A clean monitoring approach assumes variability and builds baselines that reflect it.
“Monitoring is not watching a number. Monitoring is knowing when a number is abnormal for this moment.”
Seeing the problem is not the same as acting on it
A dashboard can show something is wrong and still be useless if:
- alerts have no owners
- thresholds are arbitrary
- the team argues about root cause every time
- the only response is “turn it off” or “do nothing”
A monitoring program becomes valuable when it turns signals into decisions.
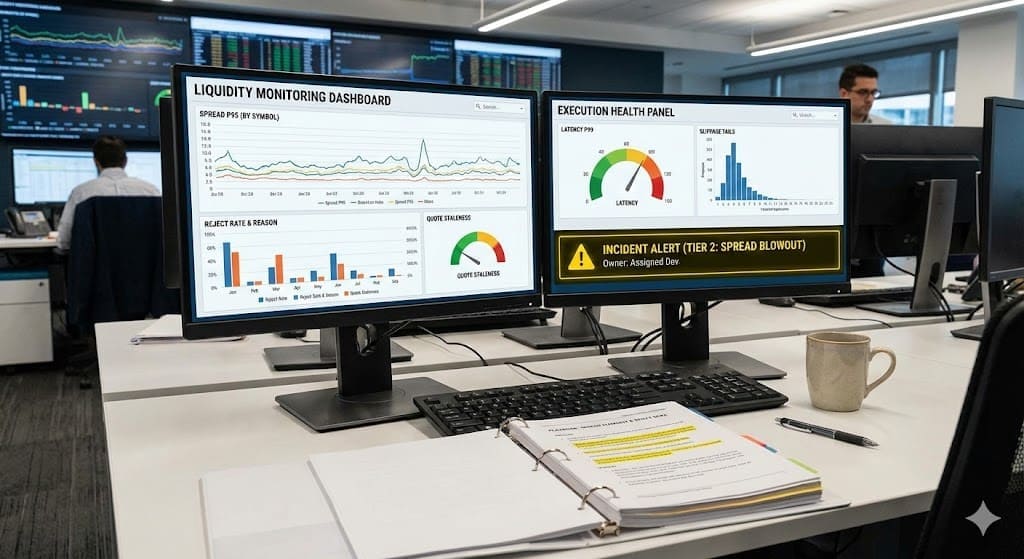
The monitoring stack that works on busy days
A practical monitoring stack has layers. Each layer answers a different question, and together they explain most incidents quickly.
Layer 1: Price integrity and quote health
This is where a spread monitor belongs, along with quote freshness checks.
Monitor:
- spread percentiles (p50 and p95, not only averages)
- quote update frequency (ticks per minute)
- stale quote ratio (quotes older than tolerance)
- cross-source price divergence (outlier detection)
Why it matters: If quotes are unhealthy, everything downstream looks like execution failure even when routing is fine.
Layer 2: Order flow health and routing outcomes
This is where you measure the plumbing of trading orders execution.
Monitor:
- reject rate by symbol group and route
- reject reason categories (liquidity, risk, platform)
- fill latency percentiles (p95 and p99)
- partial fill rate by size bucket
- timeout rate and retry behavior
This layer is the best early read on trading speed and stability, because it shows whether the system behaves normally under load, not just during calm periods.
Layer 3: Exposure and concentration
Liquidity incidents become brokerage incidents when risk concentrates.
Monitor:
- exposure by symbol, cohort, and partner group
- margin stress velocity (accounts nearing stop-out)
- concentration by route (too much flow on one path)
- abnormal profit signatures that suggest toxic flow
A starter table of signals, metrics, and action intent
| Signal | Metric to watch | Segment by | Primary intent |
| Spreads widening | p95 spread vs baseline | symbol, session | detect liquidity thinning early |
| Quotes aging | stale quote ratio | provider, symbol | avoid “bad price” disputes |
| Orders rejecting | reject rate + reason codes | route, symbol | isolate routing or venue issues |
| Fills degrading | slippage tail p95 | order type, size | protect client experience |
| System slowing | latency p99 | route, session | protect trading speed and stability |
| Risk building | exposure concentration | cohort, partner | prevent blowups and late reactions |
This table is intentionally small. Over-monitoring creates alert fatigue.
Designing a spread monitor that is actionable
A spread monitor is useful only if it answers one question: “Is this spread behavior normal for this market and this hour?”
Percentiles beat averages
Averages are comforting. Percentiles are honest.
Track:
- p50 spread: typical conditions
- p95 spread: stress conditions that clients notice
- max spread: outliers worth investigation
Then baseline by session. A p95 spread at 3:00 a.m. may be normal for one instrument and alarming for another.
“The p95 is where trust is won or lost, because that is where traders remember the pain.”
Tie spreads to other signals
Spreads alone can widen for benign reasons. The most useful approach correlates:
- spread p95 worsening
- plus reject rate increasing
- plus quote staleness rising
- or latency p99 degrading
When two or three move together, you have a real incident, not noise.
A simple spread rule set you can actually run
| Condition | Example threshold style | Typical response |
| Mild deviation | p95 spread > 1.5x baseline for 10 min | notify ops, watch closely |
| Confirmed incident | p95 > 2x baseline plus reject spike | route review, protective filters |
| Severe stress | max spread outliers plus staleness | freeze affected symbols or tighten risk checks |
| Session transition | known window (open/close) | apply temporary playbook rules |
The exact multipliers depend on your instruments and venues. The structure is what matters.
Turning dashboards into decisions with playbooks
When spreads blow out or rejects spike, the worst-case scenario is improvisation. A playbook makes response consistent, auditable, and faster.
Playbook 1: Spread blowout
Trigger
- p95 spread exceeds baseline band for 10 minutes
- plus either staleness increase or reject spike
First actions
- confirm quote health: tick rate, feed gaps, outliers
- compare spread behavior across liquidity sources
- check whether issue is isolated to a symbol group or route
Mitigation options
- apply protective spread filters where policy allows
- reroute flow away from degraded sources
- temporarily tighten size caps on affected symbols
Communication
- send a short internal note to support with plain language:
- affected symbols
- expected behavior (wider spreads, possible rejects)
- estimated review time
- affected symbols
Playbook 2: Reject spike
Trigger
- reject rate doubles baseline for a symbol group in a short window
First actions
- break rejects into categories:
- liquidity reject
- risk reject
- platform or validation reject
- liquidity reject
- isolate by route and venue response
- check timeouts and retry behavior
Mitigation options
- reroute a portion of flow
- apply throttling for burst traffic
- temporarily adjust risk checks if they are causing false rejects
Critical habit
- never treat “reject spike” as a single problem
- it is usually multiple causes layered together
Playbook 3: Latency spike affecting trading speed and stability
Trigger
- latency p99 increases significantly vs baseline during peak session
First actions
- separate network latency from processing latency
- check risk check processing time under load
- verify database contention or logging bottlenecks
Mitigation options
- reduce non-critical synchronous tasks in the execution path
- shift heavy reporting queries off execution-critical systems
- activate a safe-mode policy for high-volatility windows
“A playbook is a decision you made in calm conditions so you do not make a worse decision under pressure.”
A compact playbook table for fast reference
| Incident | Fast indicator | Owner | First two actions |
| Spread blowout | p95 spread band breach | dealing or ops lead | validate feeds, compare sources |
| Reject spike | rejects up, reason codes shift | execution ops | segment by route, reroute fraction |
| Stale quotes | staleness ratio up | market data owner | isolate feed, apply safeguards |
| Latency spike | p99 latency up | platform ops | find bottleneck, reduce sync load |
| Slippage tail event | slippage p95 worsens | execution + risk | correlate with spreads and latency |
If you cannot assign an owner, the incident will be “owned by everyone,” which means owned by no one.
Multi-asset complications you should expect
Monitoring becomes more important as you add instruments or asset classes, because behavior changes.
Stress windows differ by market
- FX: session transitions and news releases
- Indices: open and close bursts
- Commodities: scheduled reports and sudden repricing
- Equities: auctions, halts, liquidity pockets
A good monitoring system stores separate baselines by:
- asset class
- symbol group
- session window
Otherwise your alerts will either be too noisy or too blind.
Execution and liquidity are not the same problem everywhere
In some markets, spread widening is normal at open. In others, it signals a feed issue. Monitoring needs context, not just thresholds.
Cohort and route visibility: the scale upgrade most teams skip
Execution incidents become painful when you cannot answer:
- “Is this coming from one partner cohort?”
- “Is one route producing most rejects?”
- “Are new-funded accounts generating most complaints?”
- “Is one symbol group driving margin stress?”
Cohort segmentation is a practical way to prevent broad, blunt restrictions that punish good flow.
A simple segmentation model:
- new funded (first 30 days)
- active retail (steady volume)
- VIP
- partner cohorts (IB groups, affiliates)
- high dispute cluster (repeat issues)
“Scaling breaks when you manage everyone the same way, even though behavior is not the same.”
Evidence trails that cut disputes and compliance pain
Monitoring is not only about prevention. It is also about speed of explanation.
A minimum “execution evidence pack” should include:
- order timestamp and receipt timestamp
- quote snapshot at order time
- route and venue response
- fill timestamp and latency breakdown
- spread state at entry
- reject reason code dictionary
If support can pull this quickly, escalations shrink and the team stops guessing.
A 30-day implementation plan that avoids chaos
You can improve monitoring without rebuilding your entire stack. The trick is prioritizing signals, ownership, and baselines.
Week 1: Baselines and definitions
- define symbol groups and sessions
- baseline spreads, rejects, latency percentiles for 14 days
- standardize reject reason codes
Second week: Spread monitor plus alert tiering
- implement p50 and p95 spread tracking by session
- define alert tiers (informational, action, escalation)
- assign owners and acknowledgment expectations
Week 3: Playbooks and drills
- write three one-page playbooks (spread, rejects, latency)
- run a tabletop drill with support, ops, and risk
- refine thresholds to reduce false positives
Week 4: Cohorts and reporting
- add cohort segmentation and route-level views
- create a weekly review:
- incidents
- root causes
- actions and owners
- threshold adjustments
- incidents
The goal is steady improvement, not a one-time “monitoring launch.”
Mistakes that sabotage liquidity monitoring programs
- Monitoring averages only and missing tail events
- No session baselines, so alerts are meaningless
- Too many alerts, leading to fatigue and ignored signals
- No ownership, so response depends on who is online
- No playbooks, so every incident becomes a meeting
- No evidence pack, so disputes become arguments
If you fix only one thing, fix baselines and ownership. Everything else builds on that.
Next step before the FAQ
If you want monitoring that actually helps, start with a 14-day baseline for spreads (p50 and p95), rejects, and latency p99 by session and symbol group. Then build a spread monitor that correlates with reject spikes and quote staleness, and write three one-page playbooks so response becomes consistent. If you share your top traded instruments, busiest trading hours, and the most common complaint type, send that snapshot to your ops team and use it to pilot a tighter alert table and evidence pack that protects trading orders execution and improves trading speed and stability without adding noise.
FAQ
Why does monitoring all liquidity sources matter?
Because problems are often isolated: one venue widens spreads, one route rejects, one feed goes stale. Without visibility across sources, teams react late or blame the wrong component.
What should a spread monitor track besides the current spread?
Percentiles by session (p50 and p95), plus outliers and duration. The goal is to detect abnormal behavior, not to stare at a moving number.
Which execution metric predicts client complaints most reliably?
Slippage tail events and reject spikes. Averages can look fine while tail behavior drives most disputes and frustration.
How can alert fatigue be reduced?
Use session baselines, alert only on sustained deviations, and tier alerts by severity. Every alert must have an owner and a first-action checklist.
Does better liquidity monitoring automatically improve fills?
It improves detection and response, which reduces the duration and impact of incidents. Better fills usually come from the actions you take once monitoring reveals the cause.
What is the minimum evidence needed to resolve a fill dispute quickly?
Order timestamps, quote snapshot, routing path, venue response, latency breakdown, and a clear reject reason dictionary if a reject occurred.