



The MACD (Moving Average Convergence Divergence) is a trend-following momentum indicator that tracks the relationship between two exponential moving averages of price. It plots three parts — the MACD line, a signal line, and a histogram — and traders read their crossovers and divergences to gauge shifts in a trend’s direction and strength.
The name sounds intimidating, but the idea underneath is simple: it measures how far apart two moving averages are drifting, and how fast. That single measurement tells you whether momentum is building behind a trend or quietly draining out of it. Below we cover what the three parts are, where the 12/26/9 numbers come from, the four ways to read the indicator — signal-line crossovers, centerline crossovers, the histogram, and divergence — how to trade it with confluence, and the honest limits you need to know before you rely on it. Created by New York money manager Gerald Appel around 1977, it now ships as a default study on nearly every platform, from TradingView and MetaTrader to Thinkorswim.
What is the MACD indicator?
The MACD indicator turns two trend-following tools — moving averages — into a momentum oscillator. It does this by subtracting a longer moving average from a shorter one and plotting the result as a line that swings above and below a central zero line. When the two averages pull apart (diverge), momentum is strengthening; when they close in on each other (converge), momentum is fading. That is literally where the name comes from: the moving averages converging and diverging.
Because it blends trend and momentum in one place, it sits among the three or four most-used indicators in technical analysis, alongside the RSI, moving averages, and Bollinger Bands. It was developed by Gerald Appel — a trader, author, and founder of Signalert Corporation — in the late 1970s, and set out in his 1979 book The Moving Average Convergence Divergence Trading Method. The default settings he popularized are still the standard on nearly every charting platform today.
One thing to note up front: the oscillator is unbounded — it has no fixed ceiling or floor, and on a $5 stock it might swing between −0.20 and +0.20 while on a $4,000 index it swings by tens of points. That makes it different from the RSI indicator, which is capped between 0 and 100 and is built to flag overbought (above 70) and oversold (below 30) extremes. MACD is not designed for that job; it is designed to read the direction and strength of a trend.
The three parts of the MACD
Every reading is made of three components, usually drawn in a panel below the price chart:
- The MACD line. The core of the indicator — the difference between a fast (short-term) moving average and a slow (longer-term) moving average of price. This line reacts to changes in momentum first.
- The signal line. A moving average of the MACD line itself, which smooths it out and lags slightly behind. It acts as the trigger: crossovers between the MACD line and the signal line are the most-watched signal of the three.
- The MACD histogram. A set of bars showing the gap between the MACD line and the signal line. When the MACD line is above the signal line, the histogram is positive (bars above zero); when it is below, the histogram is negative (bars below zero). The histogram is the fastest-moving part of the indicator — it shrinks and grows before a crossover happens.
Together, the three give you a layered read: the histogram warns first, the line-and-signal crossover confirms, and the position relative to the zero line tells you which side of the trend you are on.
Where the 12/26/9 numbers come from
The indicator depends on three settings, almost always written as MACD(12, 26, 9). Here is exactly what each number does, using exponential moving averages (EMAs) — moving averages that weight recent prices more heavily (an EMA’s smoothing factor is 2 ÷ (period + 1), so a 12-EMA puts ~15.4% weight on the latest bar versus a 26-EMA’s ~7.4%) so they react faster.
Decode This — MACD(12, 26, 9):
- MACD line = 12-period EMA − 26-period EMA — the fast average minus the slow one; this line reacts to momentum first.
- Signal line = 9-period EMA of the MACD line — a smoothing of the line itself, weighting the last reading ~20%.
- Histogram = MACD line − signal line — the distance between the two, drawn as bars.
The 12, 26, and 9 are conventions inherited from the days of daily charts and six-day trading weeks, not magic numbers — they roughly represented two weeks (12), one month (26), and a week and a half (9). You can change them: a MACD(5, 35, 5) is more sensitive and suits longer-timeframe charts, while day traders sometimes run MACD(3, 10, 16) on 5-minute bars. Most traders leave the defaults alone precisely because so many other participants are watching the same standard settings.
How to read the MACD (a worked diagram)

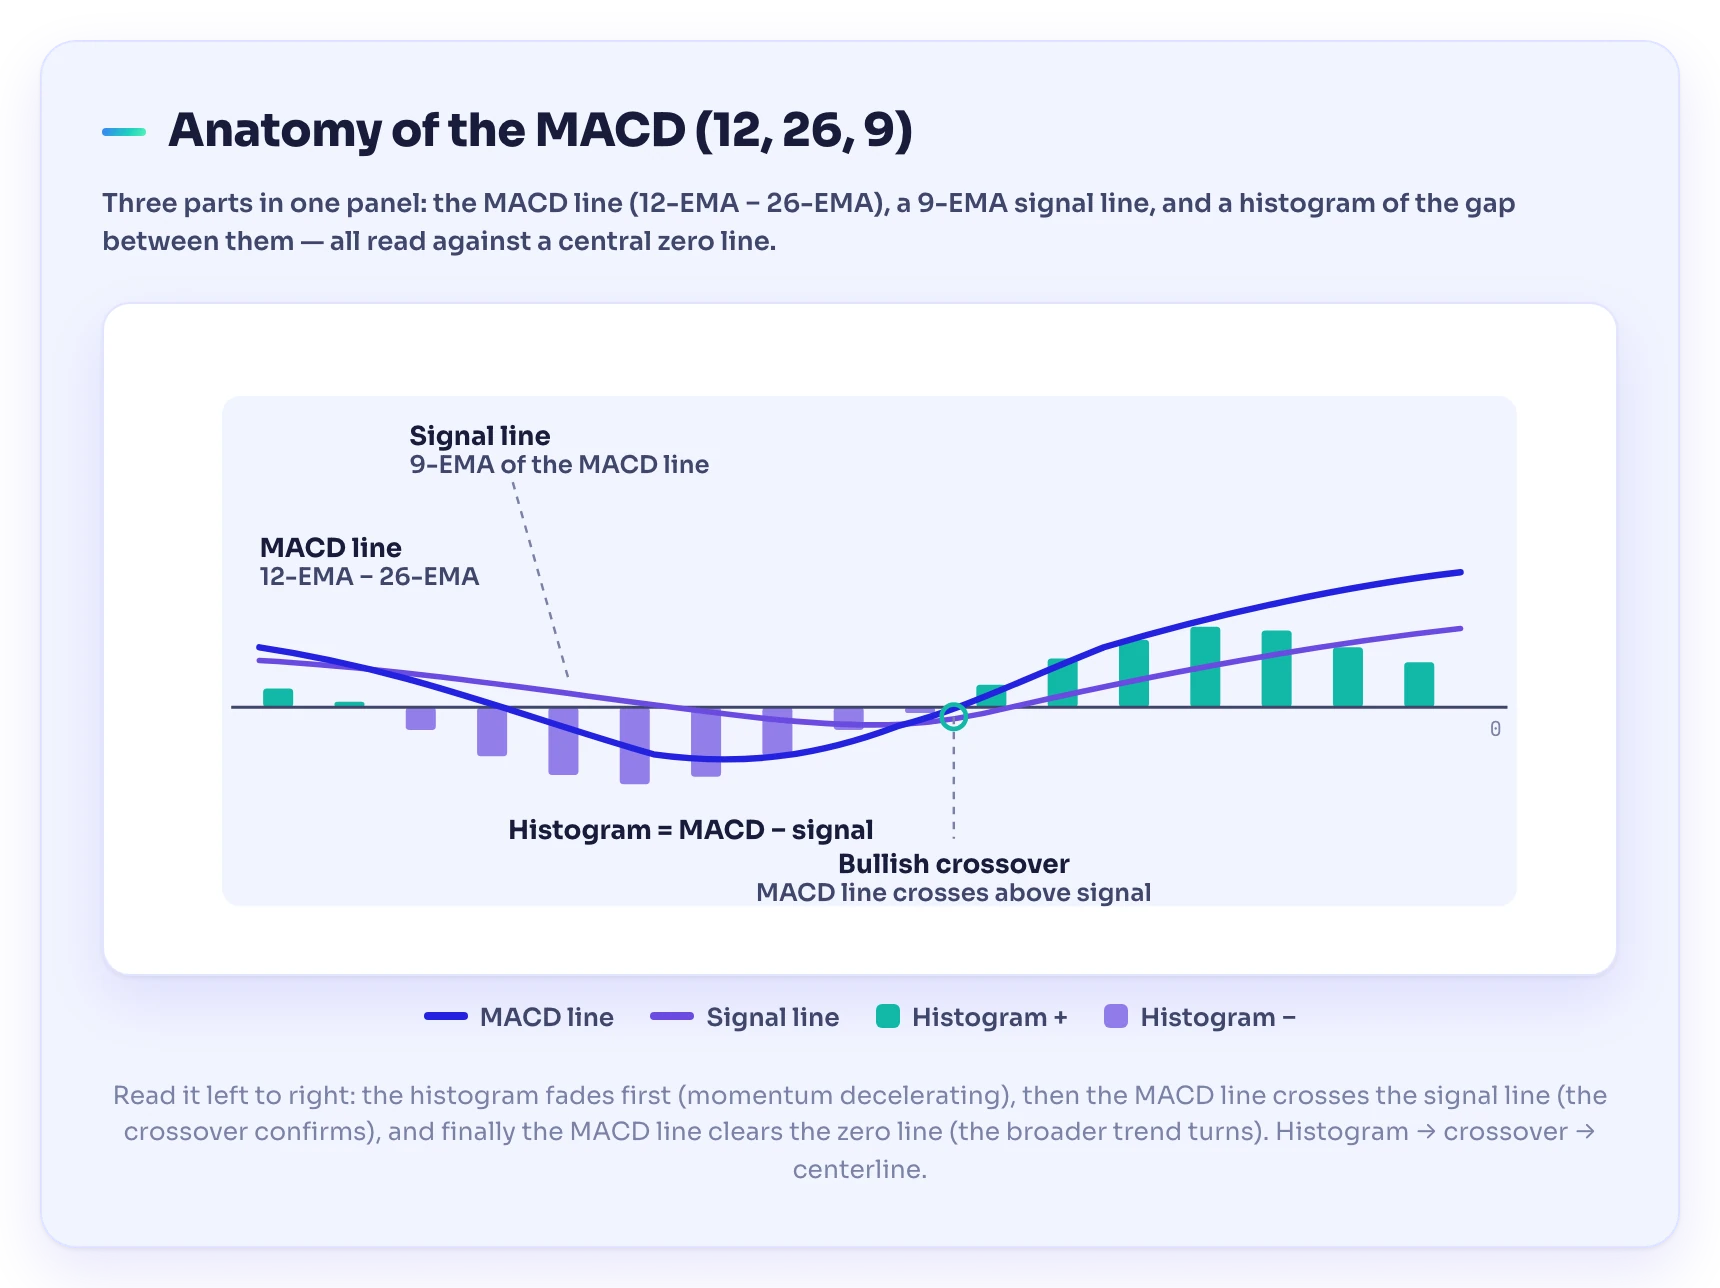
Picture the diagram above. In the top panel, price is trending; in the bottom panel sits the indicator. The MACD line (the faster line) weaves around the slower signal line, and the histogram bars fill the space between them. A horizontal zero line runs through the middle.
Follow the sequence left to right. As price rolls over and starts falling, the MACD line drops below the signal line and the histogram flips negative — momentum is now to the downside. Then price bottoms and begins to recover: the histogram bars below zero start getting shorter first, a hint the down-move is losing steam. Next the MACD line turns up and crosses back above the signal line — a bullish crossover, marked on the diagram — and the histogram flips positive. Finally, as the recovery matures, the MACD line pushes back above the zero line, confirming the shorter EMA has overtaken the longer one and the trend has turned up. That ordering — histogram, then crossover, then centerline — is the rhythm you learn to read.
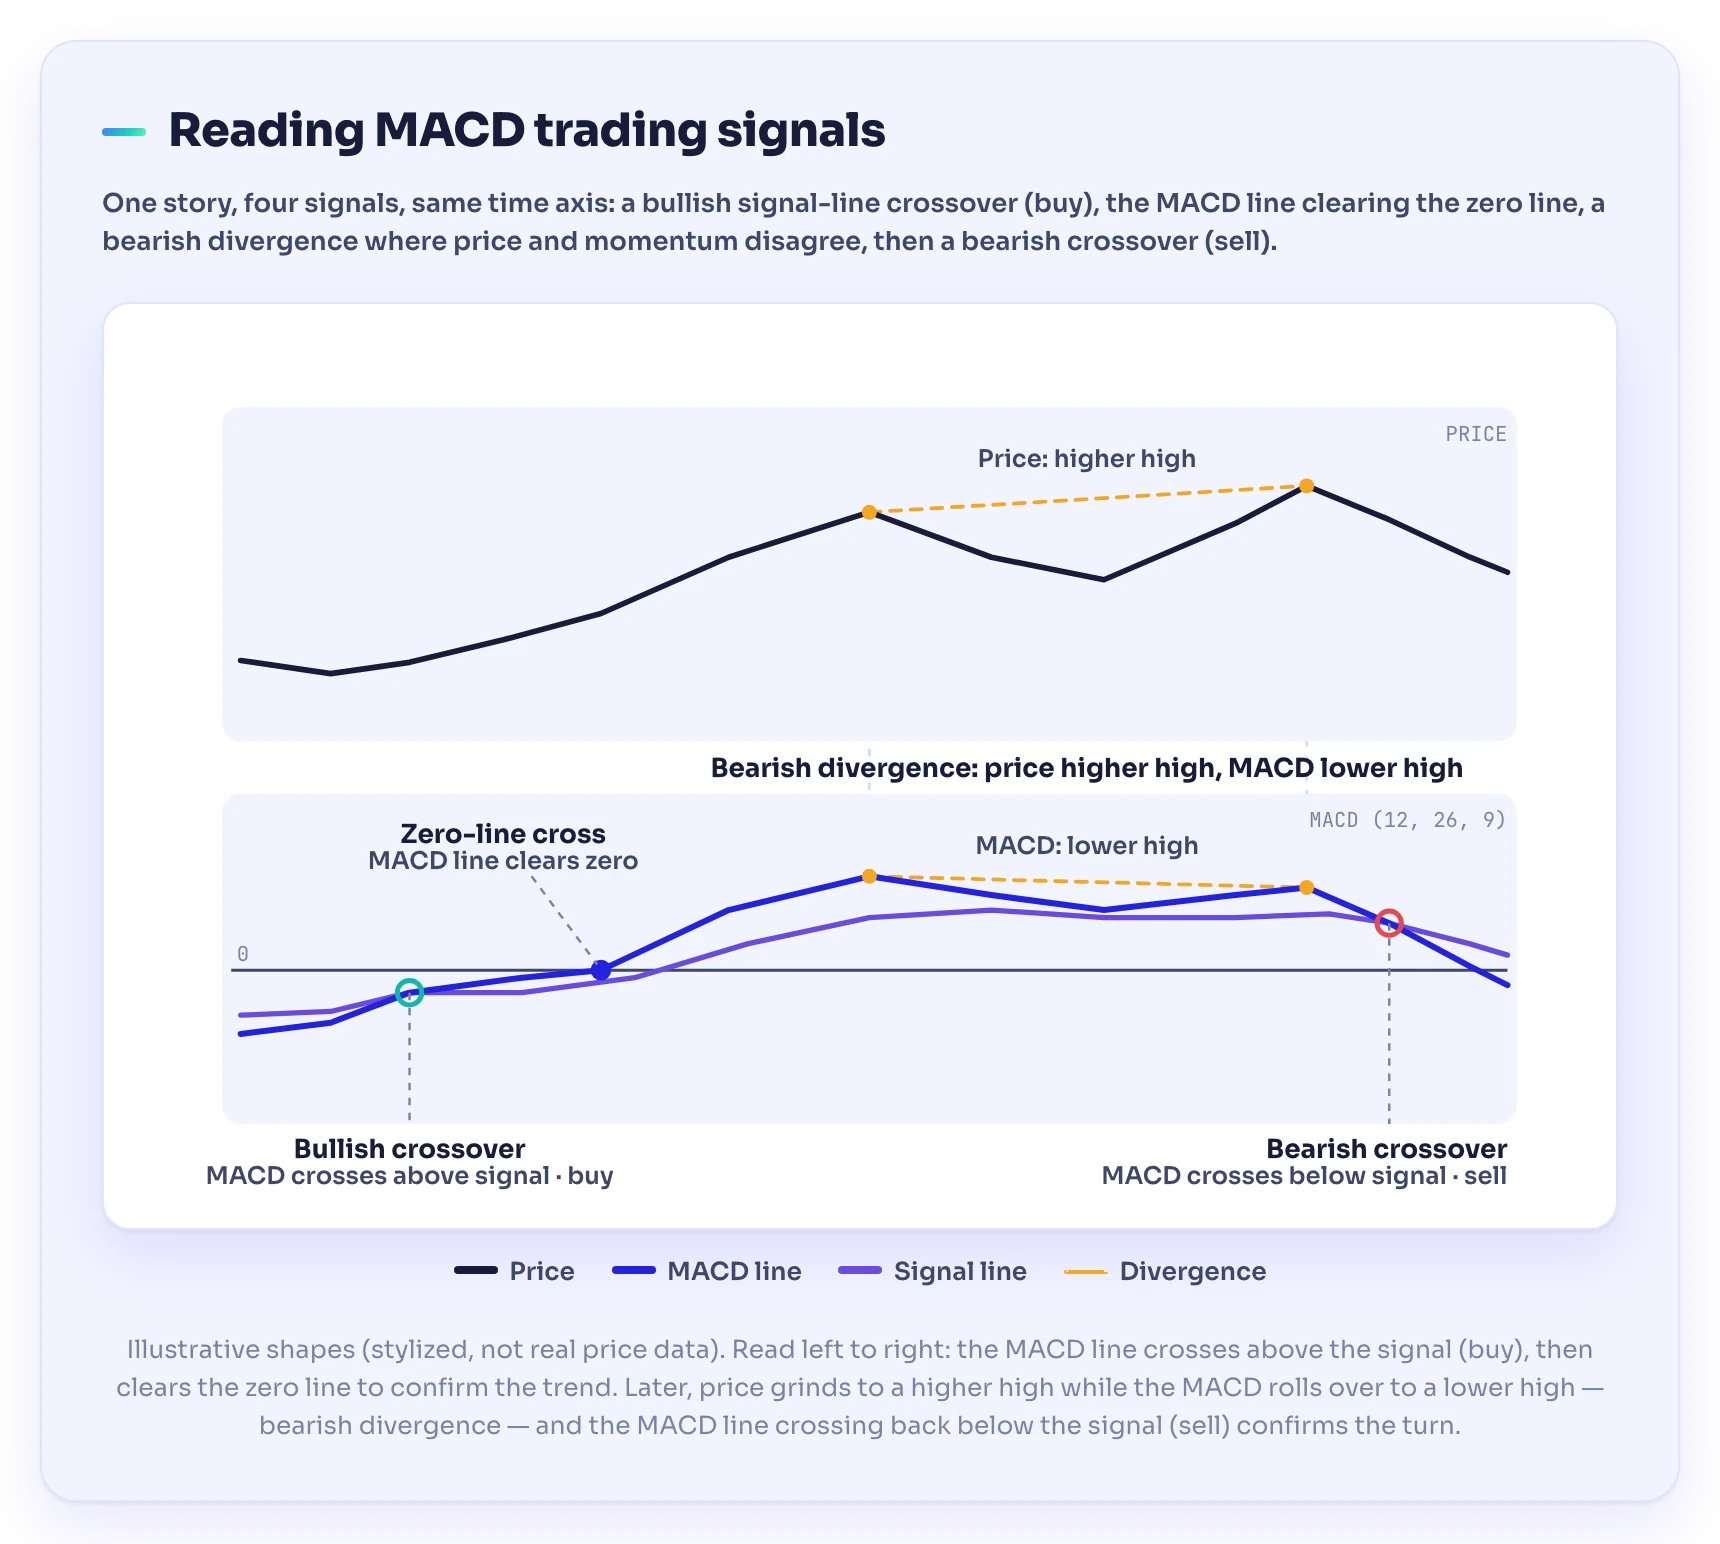
There are four distinct signals in that picture. Let’s take them one at a time.

1. Signal-line crossovers
This is the most common signal. A MACD crossover happens when the MACD line crosses the signal line:
- Bullish crossover — the MACD line crosses above the signal line. Momentum is turning up; often read as a buy signal.
- Bearish crossover — the MACD line crosses below the signal line. Momentum is turning down; often read as a sell signal.
Because the signal line lags the MACD line, these crossovers confirm a shift rather than predict it. That is a strength (fewer false starts) and a weakness (you’re a step late) at the same time.
2. Centerline (zero-line) crossovers
The zero line matters because of what the MACD line’s position means. When the line is above zero, the 12-EMA sits above the 26-EMA — the shorter-term trend is stronger than the longer-term one, i.e. bullish. When it is below zero, the reverse is true. So a cross of the zero line is a broader trend signal than a signal-line crossover: it marks the moment the two underlying moving averages themselves cross. Many traders treat a signal-line crossover as higher-conviction when it happens on the same side of zero as the trend they want to trade.
3. The histogram
The histogram is your early-warning system. Because it measures the gap between the fast line and the signal line, it starts shrinking before the two lines actually cross. Bars growing taller mean momentum is accelerating in the current direction; bars getting shorter mean it is decelerating and a crossover may be coming. Watching the histogram fade is often how disciplined traders anticipate a turn instead of reacting to it after the fact.
4. Divergence
Divergence is the highest-value — and trickiest — read. It occurs when price and the indicator disagree:
- Bullish divergence — price makes a lower low (say a stock slips from $52 to $48), but the MACD makes a higher low. The downtrend is losing momentum even as price drops; a bottom may be near.
- Bearish divergence — price makes a higher high (say $52 up to $55), but the MACD makes a lower high. The uptrend is running on fumes; a top may be forming.
Divergence Fires False Alarms: Divergence is powerful because it can hint at a reversal before the crossover confirms it — but it is also the signal that produces the most false alarms. A strong trend can diverge for a long time and keep right on going. Treat divergence as a reason to pay attention, not a reason to trade on its own.
How to trade the MACD (with confluence)
No single signal here has a proven standalone edge. What turns it into a usable MACD trading strategy is confluence — the signal lining up with other evidence. A disciplined approach:
- Trade crossovers in the direction of the bigger trend. Use a bullish crossover to enter pullbacks in an uptrend, a bearish crossover to enter rallies in a downtrend. Counter-trend crossovers fail far more often.
- Let the zero line filter your trades. Favor bullish crossovers that occur above (or are climbing toward) the zero line, and bearish crossovers below it. This one filter cuts out a lot of noise.
- Stack it with another tool, not a duplicate. Pairing the indicator with a volatility gauge like Bollinger Bands or a level tool works better than pairing it with a second momentum oscillator like Stochastics that just repeats the same information. A crossover firing exactly as price rejects a key support or resistance zone is two reasons pointing at one spot.
- Use divergence as a heads-up, then wait for confirmation. Spot the divergence, but don’t act until a crossover or a price-structure break confirms the turn.
- Always define risk first. A signal is not a guarantee. Decide your stop and position size before you enter, every time.
Worked Example: A stock in a steady uptrend runs to $50, then pulls back to $46 over a week. On the indicator, the histogram — which had gone negative during the dip — starts shrinking, then the MACD line crosses back above the signal line while both sit just above the zero line. Price is simultaneously bouncing off a prior support level near $45.50. Three things now agree: the trend (up), the location (support), and the momentum shift (bullish crossover above zero). You enter around $46.50 on the confirmation, place a stop at $44.80 (just below support, about 3.7% of risk), and manage the trade. (Illustrative — the specifics are made up; the structure of the decision, trend, level and confluence, is the point.)
The honest caveat: MACD lags, and it whipsaws
Be clear-eyed about what the indicator can and can’t do.
It lags. Built from moving averages, which are backward-looking by nature, the signal line lags the MACD line, which already lags price — so a MACD(12, 26, 9) crossover on a daily chart can print several bars after the actual turn. It confirms moves that are underway; it does not forecast them. In a fast reversal, the crossover often arrives after a chunk of the move is gone.
It whipsaws in choppy markets. This is a trend tool, and it is at its worst when there is no trend. In a sideways, range-bound market, the MACD line and signal line cross back and forth repeatedly, firing a stream of bullish-then-bearish-then-bullish signals that each lose a little money. This is the single most common way traders get chewed up: applying a trend indicator to a market that isn’t trending. If price is ranging, the honest move is often to not trade the crossovers at all.
Divergence can persist. As noted, a strong trend can show divergence for a long stretch and keep going. “Momentum is fading” is not the same as “the trend is over.”
None of this makes the indicator bad — it makes it a tool with a job. Use it to read momentum inside a trend, confirm with price and confluence, and accept that some signals will fail. The discipline to sit out the chop and to honor a stop when a signal doesn’t work matters more than the indicator itself. Our notes on trading psychology get into why traders keep trading crossovers in a dead range long after they should have stopped.
Common MACD mistakes to avoid
- Trading every crossover. In a range, most crossovers are noise. Filter with the trend and the zero line, and stand aside when there’s no trend.
- Ignoring the bigger timeframe. A bullish crossover on a 5-minute chart means little if the daily trend is firmly down. Check the higher timeframe first.
- Treating divergence as a signal by itself. Divergence flags weakening momentum, not a confirmed reversal. Wait for the crossover or a structure break.
- Using it as an overbought/oversold gauge. It’s unbounded — it was never built for that. Use RSI (with its 70/30 lines) or another bounded oscillator for extremes instead.
- Forgetting it lags. Don’t expect the indicator to call tops and bottoms. It confirms; it doesn’t predict.
- Skipping risk management. No crossover guarantees anything. A stop and sensible position size are what keep a run of false signals survivable.
Keep leveling up
The indicator is one lens on momentum, and it shines only when you can read it alongside trend, structure, and other tools rather than trusting a lone crossover.
Put in the Reps: Working through a structured path — the kind a trading academy and community like TradeGATEHub is built around — beats stitching together fragments from random videos. There is plenty of solid free trading education online to start with, and if you want a guided route from the basics to a repeatable process, explore the free lessons in the TradeGATEHub Academy.
Frequently asked questions
What is the MACD indicator?
MACD (Moving Average Convergence Divergence) is a trend-following momentum indicator that measures the relationship between two exponential moving averages of price. It plots three parts — the MACD line, a signal line, and a histogram — that traders read to judge the direction and strength of a trend and to spot potential entries and exits.
What are the 12, 26, and 9 in MACD?
They are the periods of the three EMAs. The MACD line is the 12-period EMA minus the 26-period EMA; the signal line is a 9-period EMA of the MACD line; and the histogram is the difference between the two. MACD(12, 26, 9) is the standard setting on most platforms, though the values can be adjusted.
What is a MACD crossover?
A crossover is when the MACD line crosses its signal line. A bullish crossover (MACD line crossing above the signal line) suggests upward momentum and is often read as a buy signal; a bearish crossover (crossing below) suggests downward momentum and is often read as a sell signal. Crossovers confirm shifts rather than predict them.
What does the MACD histogram show?
The histogram shows the gap between the MACD line and the signal line as bars. Positive bars mean the MACD line is above its signal line; negative bars mean it’s below. Because the gap starts changing before the lines actually cross, the histogram is an early warning that momentum is accelerating or fading.
What is MACD divergence?
Divergence is when price and the MACD disagree. Bullish divergence is price making a lower low while MACD makes a higher low (a possible bottom); bearish divergence is price making a higher high while MACD makes a lower high (a possible top). It can hint at reversals but produces many false signals, so it should be confirmed before acting.
Does the MACD indicator actually work?
MACD is a useful momentum-and-trend tool, not a guaranteed edge. It lags because it’s built from moving averages, and it whipsaws badly in sideways markets. It works best used with the larger trend, the zero-line filter, and confluence from price structure or another tool — and never as a standalone signal.
Sources
- StockCharts ChartSchool. MACD (Moving Average Convergence/Divergence) Oscillator — confirms MACD was developed by Gerald Appel in the late 1970s; defines the MACD line (12-day EMA − 26-day EMA), the signal line (9-day EMA of the MACD line), and the histogram (MACD line − signal line); and states that because MACD is unbounded it is not useful for overbought/oversold levels, with signals coming from signal-line crossovers, centerline crossovers, and divergences. chartschool.stockcharts.com
- Investopedia. Moving Average Convergence/Divergence (MACD) — confirms MACD is calculated by subtracting the 26-period EMA from the 12-period EMA, that it triggers signals when it crosses above (buy) or below (sell) its signal line, that it has a zero line marking positive/negative values, and that it helps show whether bullish or bearish price movement is strengthening or weakening. investopedia.com
Risk warning. Trading forex, CFDs, and other leveraged products carries a high level of risk and may not be suitable for all investors. The MACD is an educational indicator, not a trading signal, and does not guarantee results. This article is for educational purposes only and does not constitute financial or investment advice.