Your watchlist is moving, work messages ping, and you are trying to read a chart without holding it like a crystal ball. If that sounds familiar, you are in the right place. This page keeps how to swing trade stocks simple and practical, then layers on guardrails so you stay in the game long enough to improve.
“Swing traders hold positions for several days or weeks to capture intermediate price moves.”
Swing trading in plain English
Swing trading sits between day trading and long term investing. You look for a multi day move, use technical context to time entries and exits, and manage risk so one trade does not dominate your month. Tools are familiar: moving averages, support and resistance, momentum and volatility. The big difference is rhythm. You are not glued to screens all day, but you still respect the calendar, earnings, and gaps that can change the tape overnight.
“Slippage is the difference between expected and actual execution price, most visible during high volatility or thin volume.”
Building blocks you can rely on
Timeframe and watchlist
Pick a daily chart for the primary read and a 60 minute chart for timing. Keep a lean list of liquid names so fills are predictable and spreads stay tight.
Entry and exit logic
Define the setup first, then the exit rules. If a breakout fails, where are you wrong? If a pullback holds, where is the first target. Put that in writing so decisions feel routine, not heroic.
Position size that matches you
Size is math, not mood. Calculate trade risk as entry minus stop. Decide the cash you are willing to risk per trade, often one to two percent of account equity. Position size equals account risk divided by trade risk.
“Position sizing joins account risk and trade risk to determine how many shares to buy.”
The best swing trading strategies for stocks at a glance
| Strategy | Entry idea | Confirmation tools | Typical exit plan | Common slipup |
| Pullback in trend | Buy a brief dip during an uptrend or short a pop in a downtrend | Rising 20 or 50 day average, higher highs and higher lows | First target near recent swing, trail the rest | Entering before the pullback finishes |
| Breakout from range | Enter on a decisive move through resistance or support | Volume expansion, ADX rising for trend strength | Scale out into momentum or on first stall | Chasing extended candles |
| Mean reversion | Fade stretches away from a reference level toward the average | RSI extremes, statistical bands, research on mean reversion | Exit at the mean or when momentum flips | Fighting genuine trend days |
“Average True Range measures volatility and helps set stops at a distance that reflects recent movement.”
Practical entries, exits, and sizing
A simple three step workflow
- Identify context on the daily chart. Trend, range, or stretched.
- Plan the trade on the 60 minute chart. Entry level, stop beyond structure, target sized to the risk.
- Compute shares with the position size formula so risk stays fixed even when volatility changes.
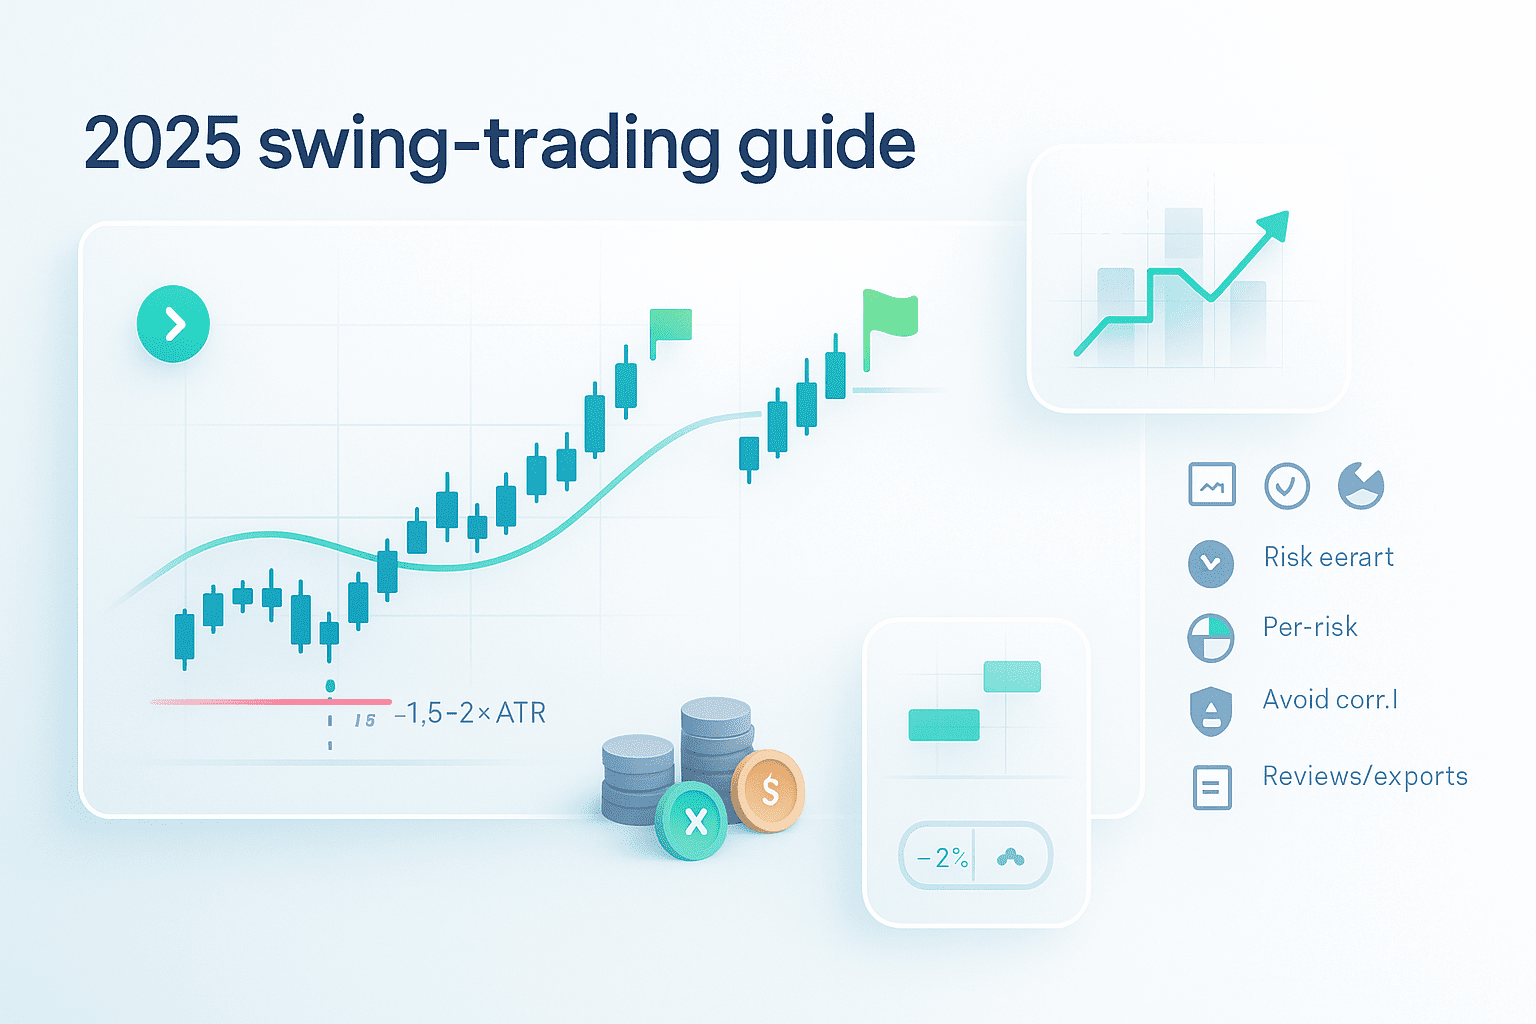
Volatility aware stops
Use ATR to avoid stops that sit inside normal noise. A stop at 1.5 to 2 times ATR from entry often survives routine wiggles while still capping loss. ATR is not magic, it is a ruler for recent movement.
Risk reward that makes sense
Aim for at least as much potential upside as downside. Many traders prefer setups that offer 1.5 to 2 times the risk. The ratio is a filter, not a guarantee.
Risk management in swing trading that survives busy weeks
- Keep a fixed percent risk per trade so a losing streak is survivable. The two percent guideline is common for active traders.
- Respect overnight risk. Gaps on earnings or macro news can jump beyond stops, creating slippage. Plan position size and events accordingly.
- Diversify your calendar, not just your tickers. Avoid stacking multiple positions that all react to the same report on the same day.
- Treat your trading plan as a living document. Change it only after measured testing, not mid trade.
Two quick examples you can visualize
Pullback in trend
A stock in a clear uptrend slips to the rising 20 day average. You enter near the prior swing high that turned into support, place the stop one and a half ATR below that level, and target the recent high for partial, trailing the rest with a swing low stop.
Breakout from range
Price compresses for two weeks under a defined ceiling. A volume surge carries it through. You enter on the break or on the first retest, cap risk below the range, and take profits into strength while the risk reward remains favorable.
“Swing trading aims to capture larger moves than day trading, with positions held for days to weeks and a focus on risk reward discipline.”
Bringing it together
Swing trading works best when your routine is quiet and your numbers are clear. Choose one primary setup, write your entry and exit rules, and let sizing do the heavy lifting so a single loss does not derail your progress. If this approach feels right, commit to two weeks of tracked trades using the methods above, then keep only the behaviors your notes confirm.
Before you scroll, jot down one setup you will trade this month, one way you will size it, and one rule you will not break. That tiny list will move you closer to how to swing trade stocks with less noise and more intent.
FAQ
Are swing strategies only technical
No. Many traders combine technical structure with an awareness of catalysts like earnings dates or macro releases. The chart times the trade, the calendar shapes risk.
Is a pullback safer than a breakout
Neither is automatically safer. Pullbacks can fail if trend momentum is fading. Breakouts can reverse if volume is weak or broader markets turn. Use stops and size consistently.
How many positions should a beginner hold
Fewer than you think. One to three concurrent positions keeps reviews honest and reduces correlated surprises on crowded news days.
Do I need special indicators
No. Price levels, moving averages, and ATR for volatility are enough to build a thoughtful routine. Add tools only when they clearly increase clarity.
Why do my fills look worse at the open
Because liquidity and volatility change quickly at the bell, which increases slippage. If early minutes stress you, wait for the first pullback or retest.