For many traders, trading stocks using RSI offers clarity. RSI is a momentum oscillator that tracks the strength of recent price gains versus losses. Traders can quickly see if a stock is gaining or losing momentum. This is because it gives clear numbers from 0 to 100.
It’s less noisy than some tools and offers a signal-forward approach. One source says, “The RSI shows traders when an asset is overbought or oversold.” This helps identify when trends may be ending or reversing
How RSI Measures Market Strength
The RSI formula calculates average gains vs average losses over a specified period (commonly 14 days). That result is scaled to produce a value between 0 and 100.
Typical interpretations:
- Above 70 suggests overbought
- Below 30 suggests oversold
- Around 50 indicates balanced momentum
Many traders treat RSI readings as a speedometer for momentum, high readings suggest strength, low readings suggest weakness.
RSI Overbought and Oversold Levels
Identifying RSI overbought and oversold levels is key. Traditionally:
- RSI > 70 = overbought; possible sell or wait
- RSI < 30 = oversold; possible buy or watch for reversal
In trending markets, these thresholds may shift, for instance, some strong uptrends hold RSI above 70 or only pull back to 40–50. Conversely, bear trends can keep RSI under 50 consistently.
Using RSI for Trade Entries and Exits
Common RSI-based rules include:
- Buy when RSI falls below 30 and then crosses back above.
- Sell (or short) when RSI exceeds 70 and then drops below.
- Look for bullish or bearish divergences (price forms lower low, RSI forms higher low, etc.)
Supporting filters can include trend alignment. Don’t buy oversold signals when the market is in a downtrend. Also, avoid selling overbought signals in a strong uptrend.
Pairing RSI with Other Indicators
RSI performs best alongside confirmation tools:
- MACD for momentum confirmation
- Moving average crossovers for trend direction
- ADX to gauge trend strength before acting on RSI
“RSI is powerful but not foolproof. Combining it with trend indicators or support/resistance improves reliability”
Selecting Timeframes and Settings
RSI works differently across timeframes:
| Trading Style | Period | Thresholds |
| Swing / Daily | 14-day | 30/70 |
| Day trading | 14-min | 20/80 |
| Scalping | 7-min | 10/90 |
Shorter frames generate more signals but also more noise, while longer periods reduce false actions but may delay entries.
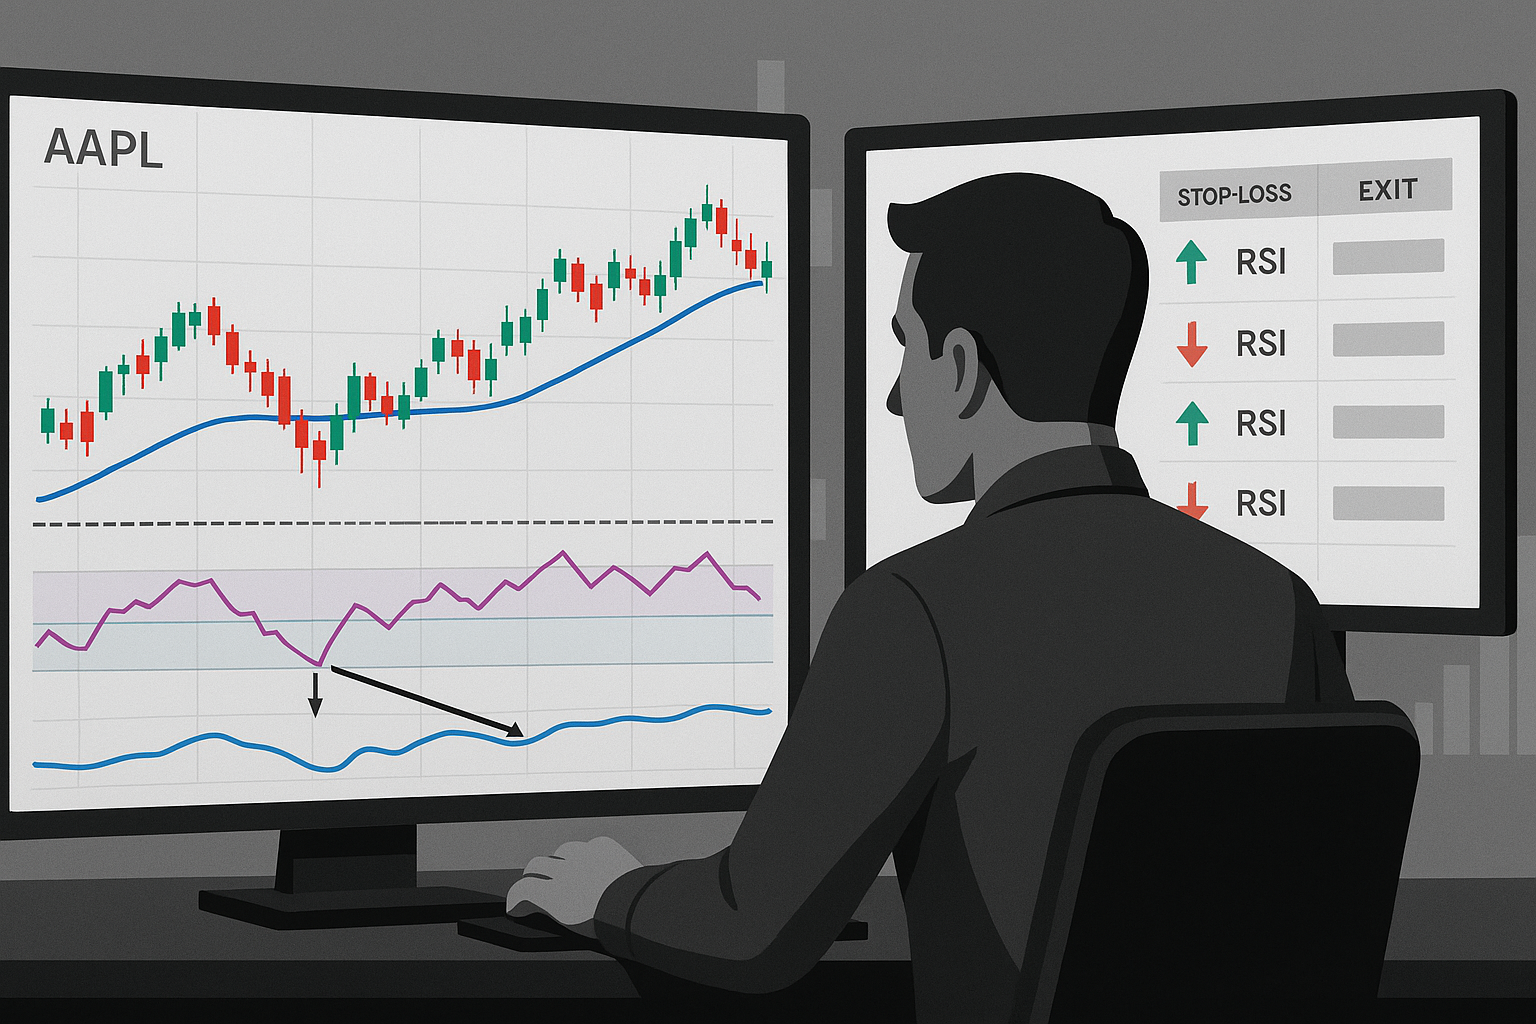
Illustrative Trade Walk-through
A simple trade might go like this:
- Apple (AAPL) RSI dips to 28 mid-session.
- It then ticks back and closes above 30.
- Price confirms by bouncing off a known support.
- Entry placed close above the trigger candle, stop just below support.
- Exit when RSI back above 70 or price hits resistance.
That process combines signal clarity with risk control.
Strengths and Limitations of RSI-Based Trading
Advantages:
- Simple to understand and apply, even for beginners
- Available on nearly all trading platforms
- Performs well in sideways or mean-reverting markets
Drawbacks:
- Can produce misleading signals during strong trends
- Needs additional filters or confirmation tools to reduce noise
- Less effective in clear trending conditions
Knowing when RSI shines (and when it doesn’t) is key to building smarter, more balanced trading strategies.
Risk Control with RSI Signals
Smart risk rules help:
- Define position size (e.g. 1-2% risk per trade)
- Use clear stop placement outside recent swing high/low
- Scale out of winners or trail stops logically
- Avoid chasing overextended RSI signals
“Controlling risk helps you stay in the game longer. Winners don’t matter if you take too many risks.”
Common Pitfalls & How to Avoid Them
Watch for these mistakes:
- Buying oversold RSI in persistent downtrends
- Ignoring divergence warnings
- Using one-length RSI settings across all stocks
- Skipping trade journal reviews
Divergence signals (like price rising but RSI failing to confirm) often precede trend reversals.
Building a Reliable Routine
Consistency matters. Effective habits include:
- Backtesting signals over months or years
- Journaling setups, outcomes, tweaks
- Reviewing regular loss patterns
- Maintaining trading windows and times
This builds intuitive pattern recognition alongside discipline.
Fine-Tuning Entry Techniques
Depending on a stock’s behavior, some traders:
- Adjust overbought/oversold levels (e.g. 80/20 in high-volatility stocks)
- Use RSI failure swings or centerline cross (50-level) to confirm
- Layer trend filters (like 200‑day moving average)
These refinements make signals more meaningful per stock or timeframe.
Performance Tips for RSI Traders
To sharpen execution:
- Don’t trade during low volume or lunchtime chop.
- Wait for the candle to close to avoid false breakouts.
- Observe RSI behavior on higher timeframes before acting.
- Use alerts tied to RSI thresholds for timely execution.
Mixing RSI with Other Strategies
Some traders mix RSI-based scalping with trend-following entries that use moving averages. Others combine breakout setups with momentum divergence signals. This hybrid method creates dynamic entry opportunities without signal overlap.
Readiness Checklist Before Trading Live
- RSI settings tailored to your timeframe
- Defined entry, stop, and exit rules
- Demo-tested trades logged for review
- Mental filters for avoiding impulsive trades
When these pieces are in place, remote setups become manageable and confidence grows.
FAQs
Can RSI work on all stocks?
It does best on trading stocks that exhibit mean-reversion or regular pullbacks. Very erratic or thinly traded stocks may give unreliable signals.
Is RSI overbought and oversold always accurate?
Not always. In strong trends, RSI may stay over 70 or under 30 for extended periods. That’s why context matters.
Can I use RSI intraday and overnight?
Yes, but adapt thresholds. Intraday trading often uses tighter thresholds to match higher noise levels.
Is divergence more reliable than crossing thresholds?
Divergence often signals exhaustion earlier than thresholds. Combining both gives stronger confirmation.
How do I avoid RSI giving false signals?
Use trend filters, avoid choppy ranges, and wait for RSI to cross back rather than react at extremes alone.
Are backtested RSI strategies reliable?
They can be, some research shows high success rates when filters are applied, but always factor in slippage, fees, and changing market conditions